
Business impact across your data sources
Compare your data sources by usage, employee access, data sensitivity and cyber posture to spot risky, unnecessary or well-managed systems.
Not every system in your inventory carries the same risk. A tool that many employees can access but rarely use, or a vendor with weak security handling sensitive data, deserves more attention than a well-secured system used daily by a small team. The Business impact view compares your data sources across four dimensions, so you can quickly see which systems to review, restrict or retire.
Open the business impact view
In the left navigation, under Governance, select Risks, then select the Business impact tab.
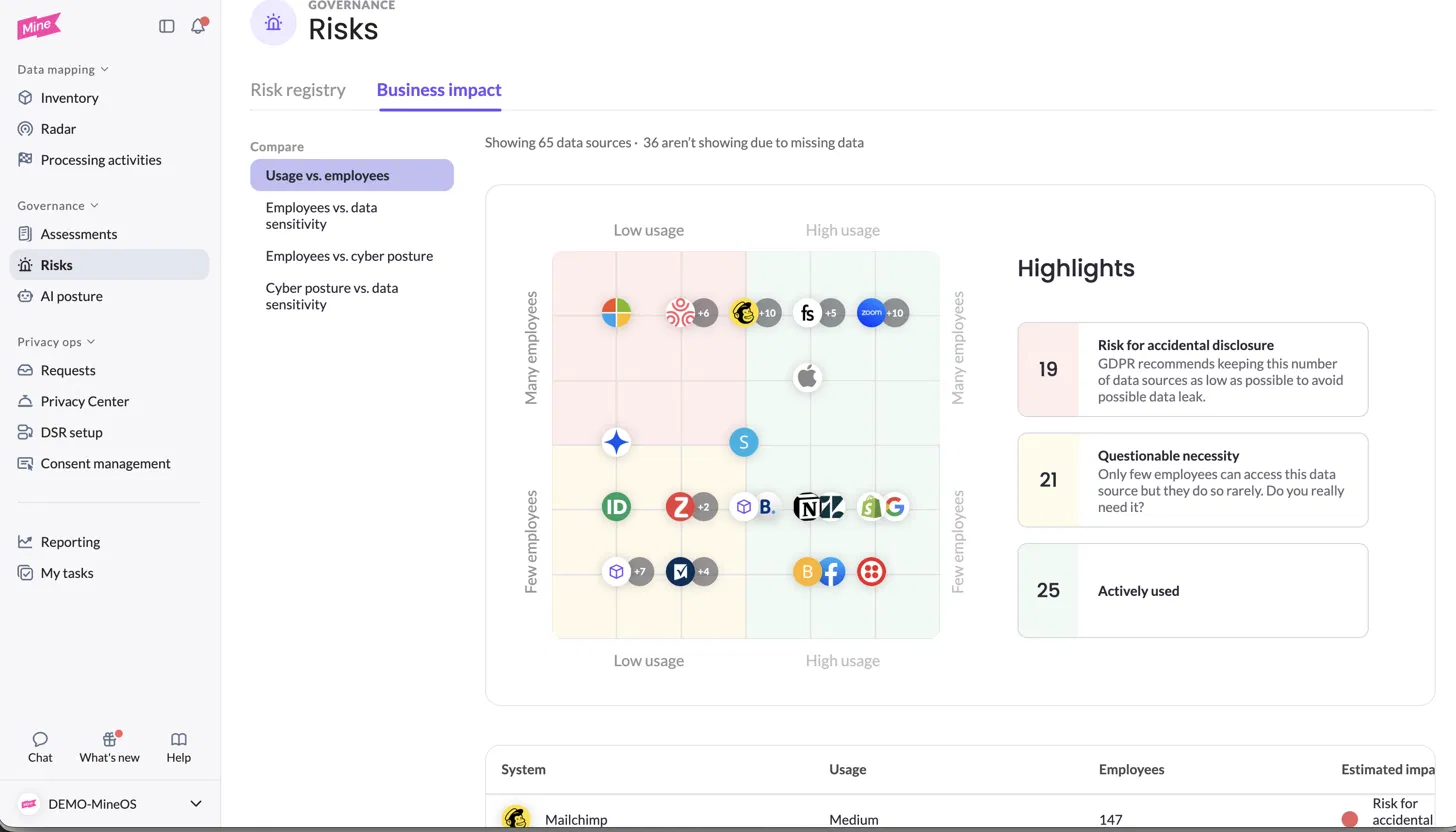
How to read the view
Each comparison has three parts:
- The matrix plots your data sources on two dimensions. Red areas indicate the highest potential impact, yellow areas need a closer look, and green areas indicate good usage.
- Highlights count how many data sources fall into each impact category, with a short explanation of what it means.
- The table lists each data source with its values for both dimensions and its estimated impact.
Above the matrix, you'll see how many data sources are shown, and how many aren't showing due to missing data.
Comparisons
Under Compare, choose one of four comparisons:
| Comparison | What it helps you find |
|---|---|
| Usage vs. employees | Systems that many employees can access but rarely use, which increases the risk of accidental disclosure, and systems few people use that you may not need at all |
| Employees vs. data sensitivity | Systems where many employees can access highly sensitive data |
| Employees vs. cyber posture | Systems with weak security that many employees use |
| Cyber posture vs. data sensitivity | Vendors with weak security that hold sensitive data [confirm highlight categories] |
Impact categories
| Category | What it means |
|---|---|
| Risk for accidental disclosure | More people can access the data than need to, or sensitive data is exposed to a wider group, which increases the chance of a data leak |
| Misconduct of sensitive data | Many employees can access highly sensitive data. Review the vendor's data protection practices and who has access |
| Questionable necessity | Only a few employees access the system, and rarely. Consider whether you still need it |
| Actively used, good usage or good cyber posture | The system is well matched to how it's used, with no immediate concern |
Where the data comes from
| Dimension | Source |
|---|---|
| Usage and employees | Discovery, which detects how many employees access each system and how often [confirm: email and SSO discovery] |
| Data sensitivity | The data types assigned to each data source [confirm] |
| Cyber posture | The vendor's cyber posture rating [confirm] |
Data sources missing a value for either dimension of a comparison aren't shown in it. To include them, complete their details in your inventory: for example, set up discovery or add data types. See Navigate Your Inventory.
Act on the results
| If you see | Consider |
|---|---|
| Risk for accidental disclosure | Limiting access to the employees who need it, or reviewing whether the data needs to be in that system |
| Misconduct of sensitive data | Running a privacy or security assessment on the vendor, and reviewing its data protection practices |
| Questionable necessity | Confirming with the business owner whether the system is still needed, and marking it as unused if not |
| Weak cyber posture | Running a vendor security assessment and flagging the risk in your risk registry |
Reducing the number of systems and people with access to personal data is a core principle of privacy and security frameworks worldwide, and these comparisons help you act on it.
Related articles
- Flagging risks in assessments: record the risks you find
- Risk registry and catalog: track risks through to mitigation
- Navigate Your Inventory: complete missing data and mark unused systems
Updated about 2 hours ago